专业有效的(地下)水资源管理
(地下)水监测积累了大量的数据,对数据质和量的检查需要较多时间。GW-Base 软件能够有效、简易、快捷进行系统分析、制图和报告制作。软件收集、维护、分析单个项目所有数据,使用户数据分析更加准确便捷,无论项目大小(如:只有 3 个监测井的供气站或超过 1000 口井的地下水监测工程),用户都能够通过软件管理地下水信息和水文地质信息。
Main Features of GW-Base
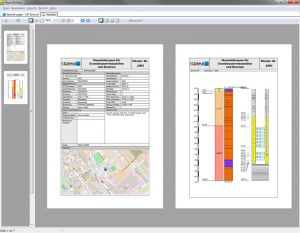
Print Template Designer
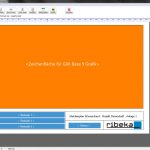
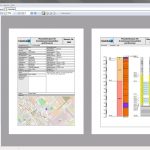
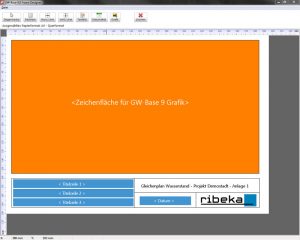
The new GW-Base print template designer enables you to create customized layout templates for your charts and maps quickly and easily.
Title blocks with titles, logos, free text, additional images and frames can be designed according to the requirements of your printouts.
Map Management
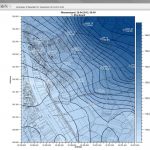
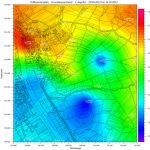
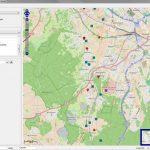
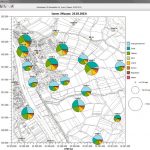
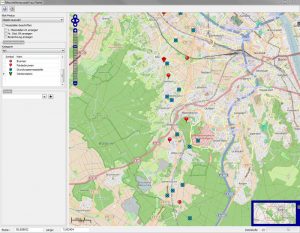
The GW-Base map management can provide individual maps for all project-specific fields of application.
All common map file formats are supported (e.g. raster formats like * .jpg, * .tif, * .bmp with world file, GeoTiff, but also vector formats like * .shp, * .dwg or * .dxf). Individual raster maps without a world file can be georeferenced in GW-Base. Alternatively, online maps from the OpenStreetMap web service can be used for map display and evaluations.
座标系统
使用 GW-Base 能够将高斯座标的数据转换成 UTM 座标,如监测井基本数据、地图数据和地形数据。
UTM 座标系将保存在另外的数据库中,客户可以根据需要选择不同的座标系进行了工作。
统计
井的统计数据如最大、最小和平均值等,用户可以通过 GW-Base 8.0 方便确定,计算水利数据统计值,用户需定义起始年。
用户也可以通过 GW-Base 进行流量数据的统计,所有的统计数据结果可以输出到 Excel 文件中。
数据的安全性
用户使用 GW-Base 能够方便快捷生成数据备份,用户将选择的项目有成备份文件,ZIP 压缩文件,保存到用户指定的目录。
Import and Interface for Automatic Imports
All import tools are equipped with import wizards that guide you through the import process. This enables even users who are not familiar with the program to import data into GW-Base without difficulties.
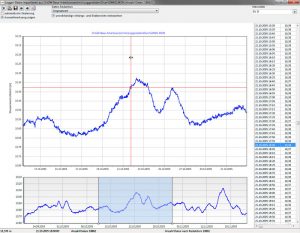
With the integrated logger data import tool you are able to import all data collected by automatic data loggers. Independently of logger manufacturer or type, data from all loggers, starting from simple water level loggers to complex multi-parameter loggers and climate stations can be imported.
A graphically controlled data reduction feature facilitates the target-oriented acquisition of only those datasets that are really required (e.g. daily average, min-max or event-driven). Each import process is logged (date, editor and content, the name and path of the import file) and can be undone if necessary.
Interface for Automatic Imports
The auto-import interface is able to directly connect to your control room, your lab or telemetry equipped monitoring station (wells, climate stations, etc.). This way all data from data loggers can be automatically imported, regardless of logger type or manufacturer
输出
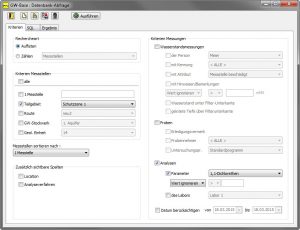
GW-Base 输出工具,将帮助用户在输出数据前确定需要输出的信息,如数据类型、选择井和时间周期等。
GW-Base 提供了多种数据输出的方法,如当用户可以选择数据输出,无需一次性将全部数据或不需要的数据输出。
GW-Base 同时开发单独有效工具,可以根据用户定义规则输出数据。数据能够直接输入到 GW-WEB ,有权限的机构、同事和客户能够通过网络获取相关数据。
GW-Base Interfaces
The import and export of data from one system to another can be complex and time consuming. To facilitate this work, we offer a variety of interfaces to GW-Base.
Next to standard interfaces like WISKI ZRXP, Excel or ASCII (e.g. * .txt, *.csv) we have developed a variety of special customer specific interfaces which are constantly complemented.
User Management
The flexible and precisely configurable user management protects all managed data and ensures that for each employee only these datasets are available that are needed for their daily work.


